Bitcoin Price Restarts Increase – Can BTC Pump To $45K Again?
Bitcoin price is recovering higher above the $42,000 resistance. BTC must clear $42,800 and $43,500 to start an increase toward the $45,000 resistance.
- Bitcoin price is moving higher above the $42,000 resistance zone.
- The price is trading above $41,500 and the 100 hourly Simple moving average.
- There is a key bullish trend line forming with support near $41,500 on the hourly chart of the BTC/USD pair (data feed from Kraken).
- The pair could start a steady increase if it clears the $42,800 and $43,500 resistance levels.
Bitcoin Price Aims Higher
Bitcoin price formed a support base above the $40,000 support zone . BTC started a decent increase above the $41,200 and $41,500 resistance levels.
It opened the doors for more gains above $42,000 and the 100 hourly Simple moving average. Finally, the price tested the $42,800 zone. A high was formed near $42,800 before there was a minor decline. The price declined below the $42,200 level.
Bitcoin tested the 23.6% Fib retracement level of the upward move from the $38,518 swing low to the $42,800 high. There is also a key bullish trend line forming with support near $41,500 on the hourly chart of the BTC/USD pair.
The price is now trading above $41,500 and the 100 hourly Simple moving average . Immediate resistance is near the $42,500 level. The next key resistance could be $42,800, above which the price could rise and test $43,500.
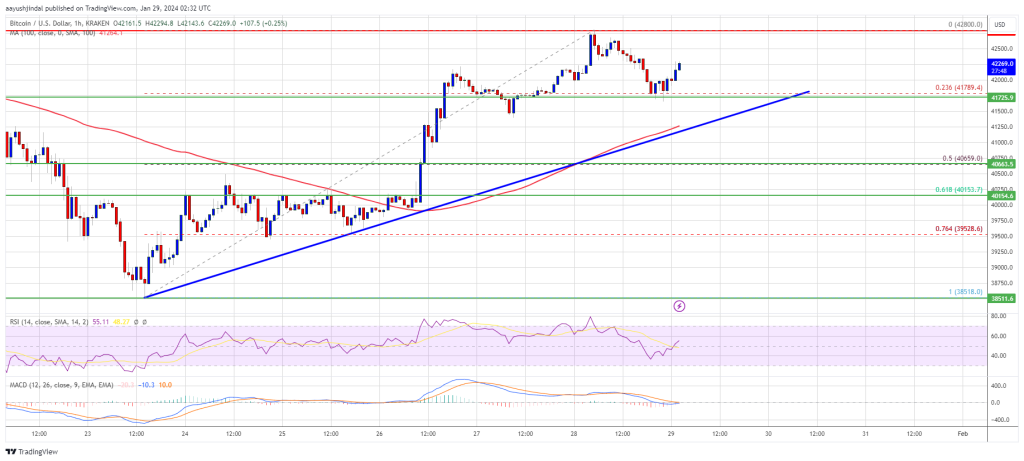
Source: BTCUSD on TradingView.com
A clear move above the $43,500 resistance could send the price toward the $44,250 resistance. The next resistance is now forming near the $45,000 level. A close above the $45,000 level could push the price further higher. The next major resistance sits at $46,500.
Another Drop In BTC?
If Bitcoin fails to rise above the $42,800 resistance zone, it could start another decline. Immediate support on the downside is near the $41,750 level.
The next major support is $41,500 and the trend line. If there is a close below $41,500, the price could gain bearish momentum. In the stated case, the price could dive toward the $40,650 support or the 50% Fib retracement level of the upward move from the $38,518 swing low to the $42,800 high in the near term.
Technical indicators:
Hourly MACD – The MACD is now gaining pace in the bullish zone.
Hourly RSI (Relative Strength Index) – The RSI for BTC/USD is now above the 50 level.
Major Support Levels – $41,500, followed by $40,650.
Major Resistance Levels – $42,800, $43,500, and $45,000.
Disclaimer: The content of this article solely reflects the author's opinion and does not represent the platform in any capacity. This article is not intended to serve as a reference for making investment decisions.
You may also like
Decoding VitaDAO: A Paradigm Revolution in Decentralized Science

Mars Morning News | ETH returns to $3,000, extreme fear sentiment has passed
The Federal Reserve's Beige Book shows little change in U.S. economic activity, with increasing divergence in the consumer market. JPMorgan predicts a Fed rate cut in December. Nasdaq has applied to increase the position limit for BlackRock's Bitcoin ETF options. ETH has returned to $3,000, signaling a recovery in market sentiment. Hyperliquid has sparked controversy due to a token symbol change. Binance faces a $1 billion terrorism-related lawsuit. Securitize has received EU approval to operate a tokenization trading system. The Tether CEO responded to S&P's credit rating downgrade. Large Bitcoin holders are increasing deposits to exchanges. Summary generated by Mars AI. The accuracy and completeness of this summary are still being iteratively improved by the Mars AI model.

The central bank sets a major tone on stablecoins for the first time—where will the market go next?
The People's Bank of China held a meeting to crack down on virtual currency trading and speculation, clearly defining stablecoins as a form of virtual currency with risks of illegal financial activities, and emphasized the continued prohibition of all virtual currency-related businesses.