Bitcoin ( BTC ) has been gradually moving up during the weekend, indicating continued demand from the bulls. Data shared by Bloomberg analyst James Seyffart on Jan. 26 shows that BlackRock's iShares Bitcoin Trust (IBIT) assets under management crossed the $2 billion mark .
Solid buying at lower levels arrested the decline in Bitcoin, but a new bull market is unlikely to start in a hurry. Bitcoin may consolidate its gains as traders focus on the inflows into the newly launched Bitcoin exchange-traded funds and wait for the Bitcoin halving in April.
![]()
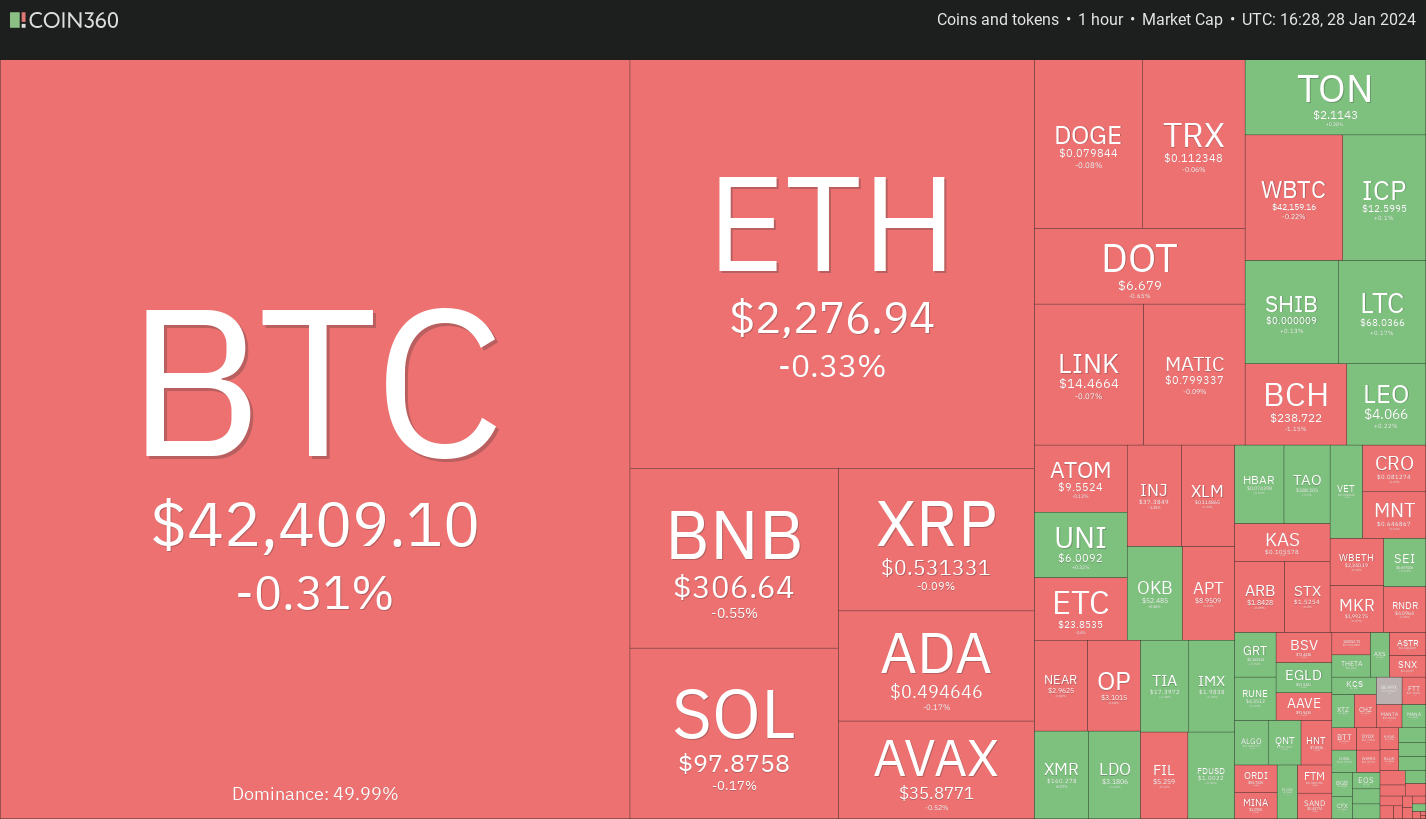
Crypto market data daily view. Source:
Coin360
If Bitcoin enters a range, it will be a positive sign as it shows that traders are not hurrying to book profits because they anticipate the uptrend to continue. That may also be good news for select altcoins, which may attract investors’ interest and resume their up move.
Bitcoin’s recovery has pulled select altcoins higher. Let’s look at the charts of the top 5 cryptocurrencies that may outperform in the near term.
Bitcoin price analysis
Bitcoin rose above the 20-day exponential moving average ($41,959) on Jan. 27, indicating that the selling pressure is reducing.
![]()
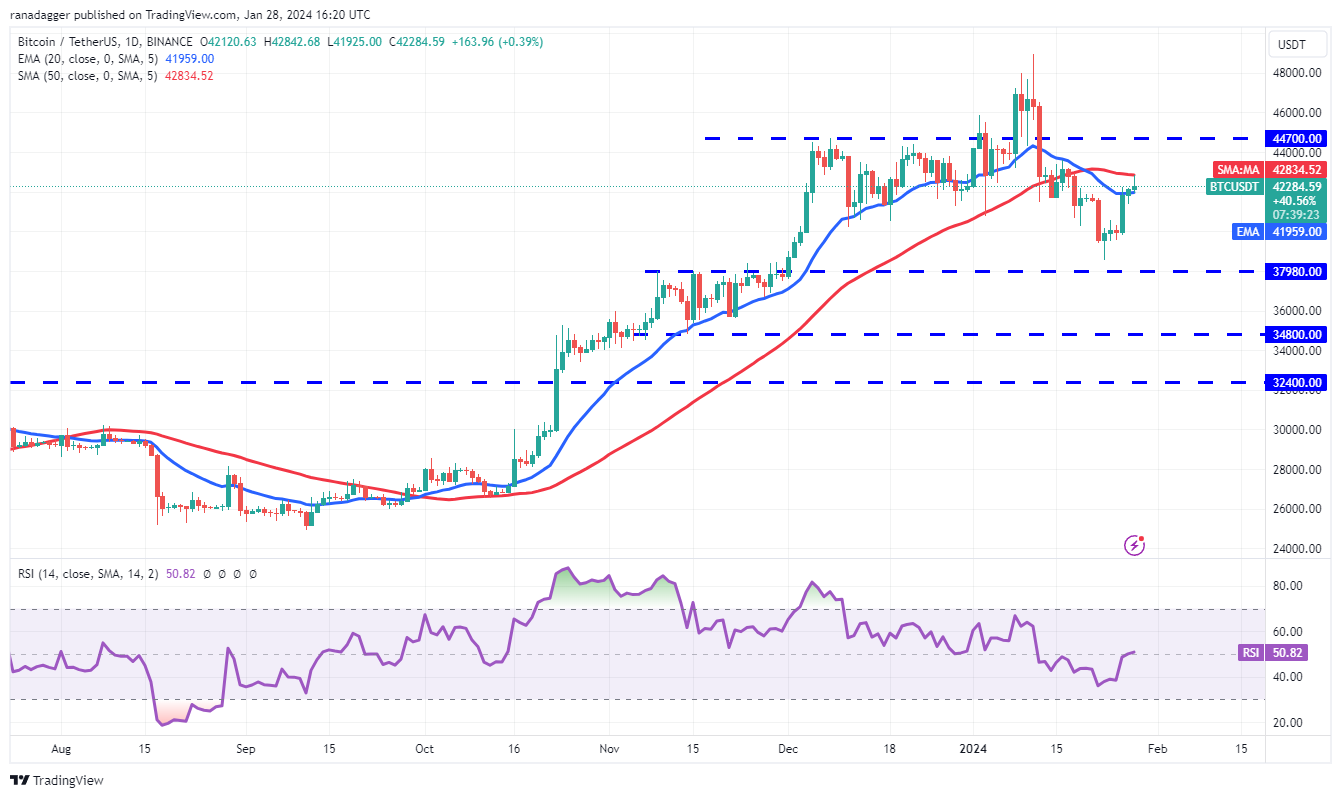
BTC/USDT daily chart. Source: TradingView
Both moving averages have flattened out, and the relative strength index (RSI) is near the midpoint, indicating a balance between supply and demand. The BTC/USDT pair may swing between $44,700 and $37,980 for some time.
A break and close above $44,700 will be the first indication that the buyers are back in the driver’s seat. That may propel the price to the local high of $48,970. On the downside, a slide below $37,980 could start a deeper correction toward $34,800.
![]()
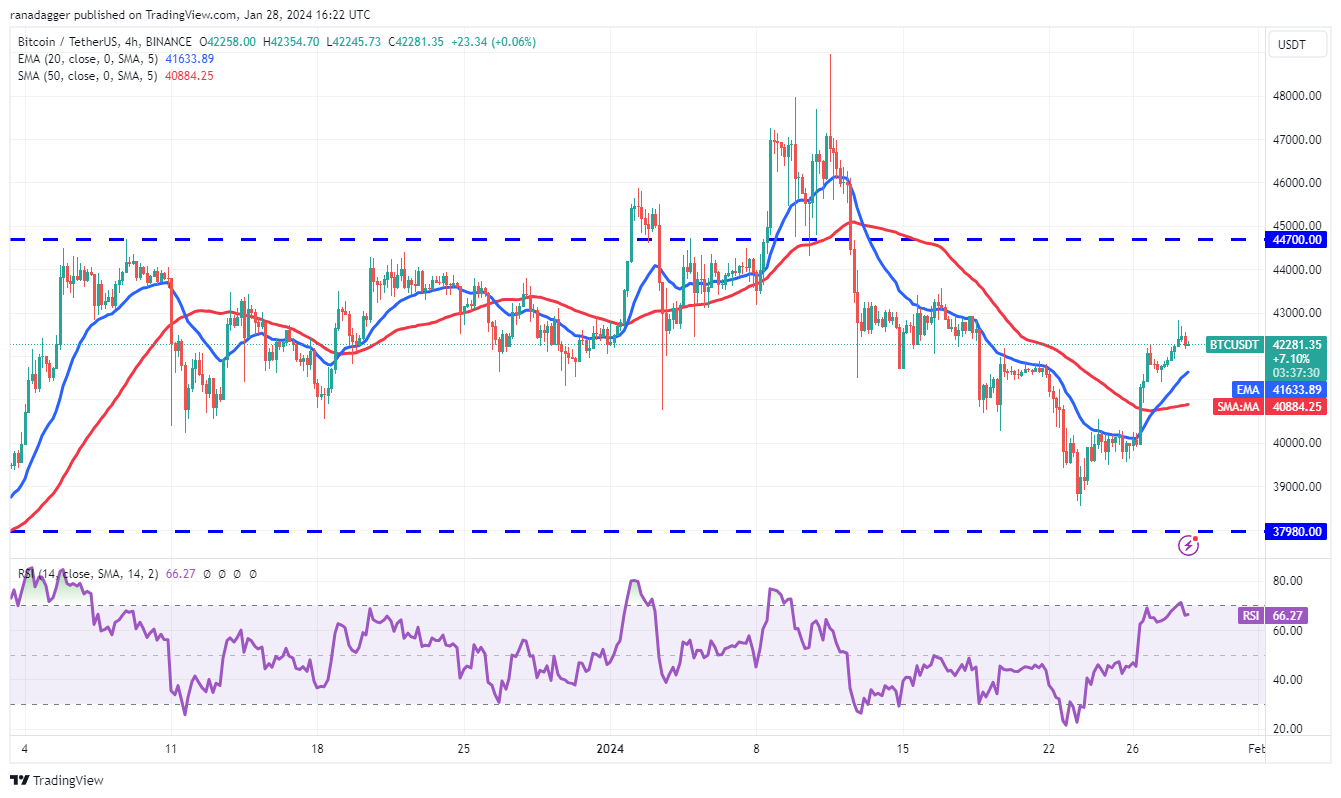
BTC/USDT 4-hour chart. Source: TradingView
The moving averages have completed a bullish crossover on the 4-hour chart, and the RSI is near the overbought zone, indicating that the bulls are on a comeback. The rally could reach $43,500 and then $44,700.
On the downside, the moving averages will likely act as a strong support. A break below the 50-simple moving average could tilt the advantage in favor of the bears. The pair may then slump to $39,500 and later to $37,980.
Solana price analysis
Solana ( SOL ) climbed above the moving averages on Jan. 27 and is trying to sustain above the downtrend line on Jan. 28.
![]()
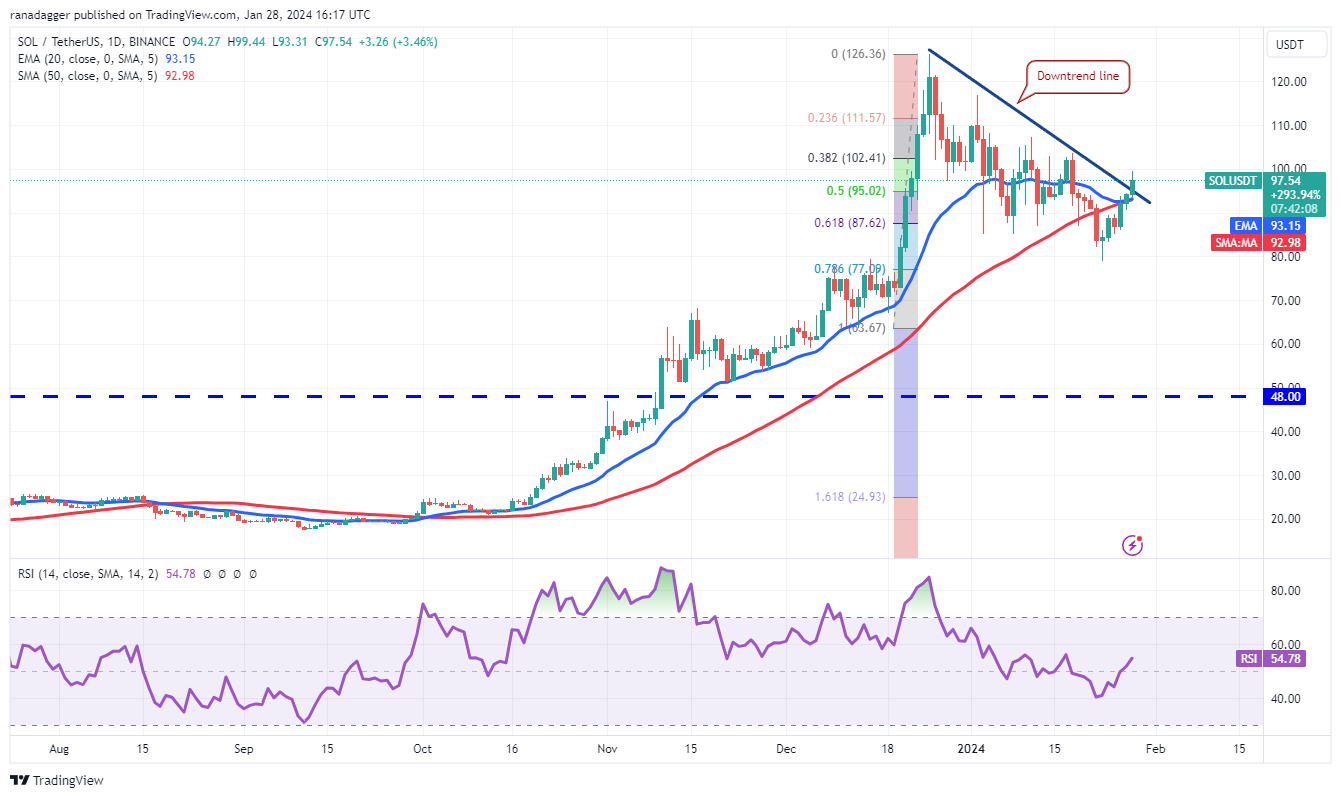
SOL/USDT daily chart. Source: TradingView
The 20-day EMA ($93) has flattened out, and the RSI is just above the midpoint, indicating equilibrium between buyers and sellers. If the price maintains above the downtrend line, the SOL/USDT pair could attempt a rally to $107 and then to $117.
If the bears want to prevent the upside, they will have to quickly pull the price back below the moving averages. That may trap the aggressive bulls, opening the doors for a retest of the support at $79.
![]()
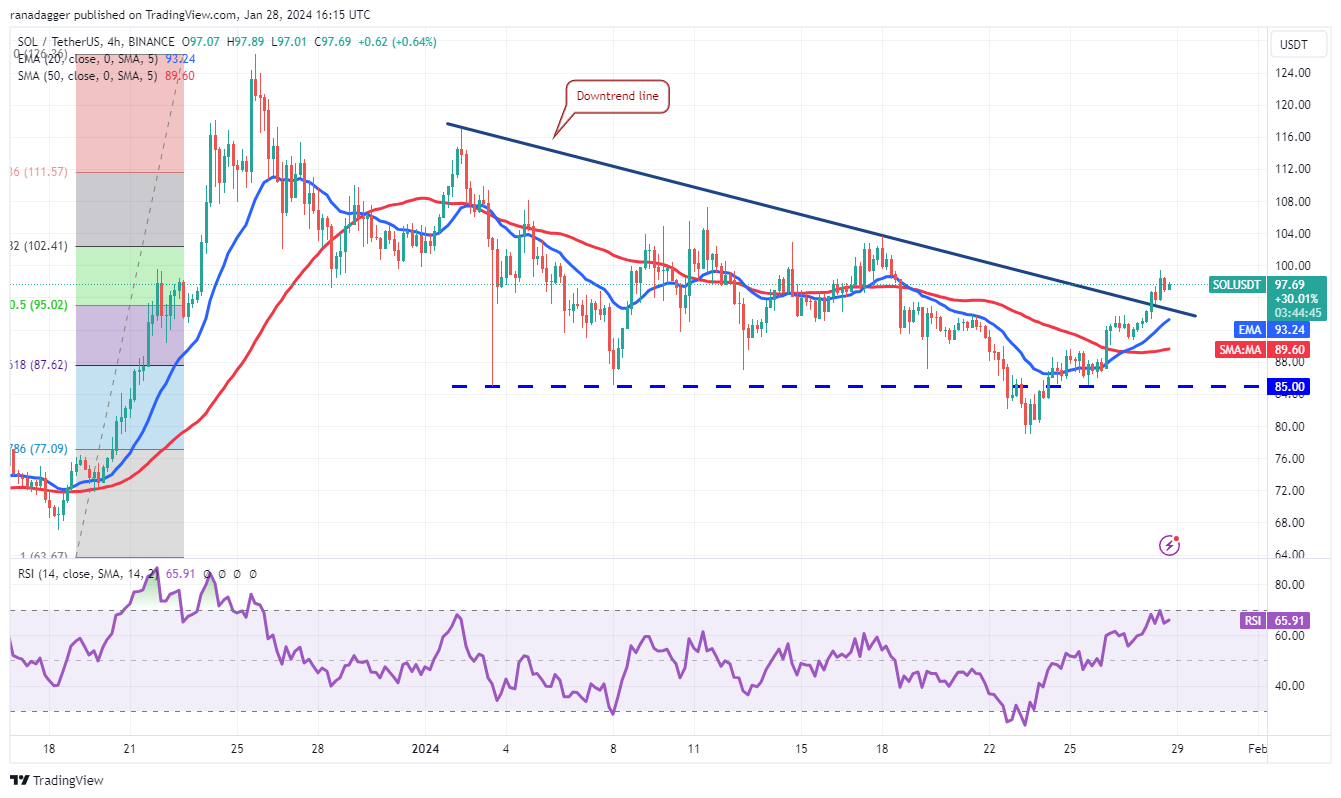
SOL/USDT 4-hour chart. Source: TradingView
The pair has risen above the downtrend line, invalidating the bearish descending triangle pattern on the 4-hour chart. This is a positive sign as the bulls waiting on the sidelines enter on the failure of the setup, and the bears rush to the exit.
If buyers hold the price above the downtrend line, the pair is likely to ascend toward $107 and later to $117. This positive view will be invalidated in the near term if the price turns down and plummets below $85.
Avalanche price analysis
Avalanche ( AVAX ) has been trading inside a descending channel pattern for several days. Buyers purchased the dip to the support line on Jan. 23 and pushed the price above the 20-day EMA ($34) on Jan. 28.
![]()
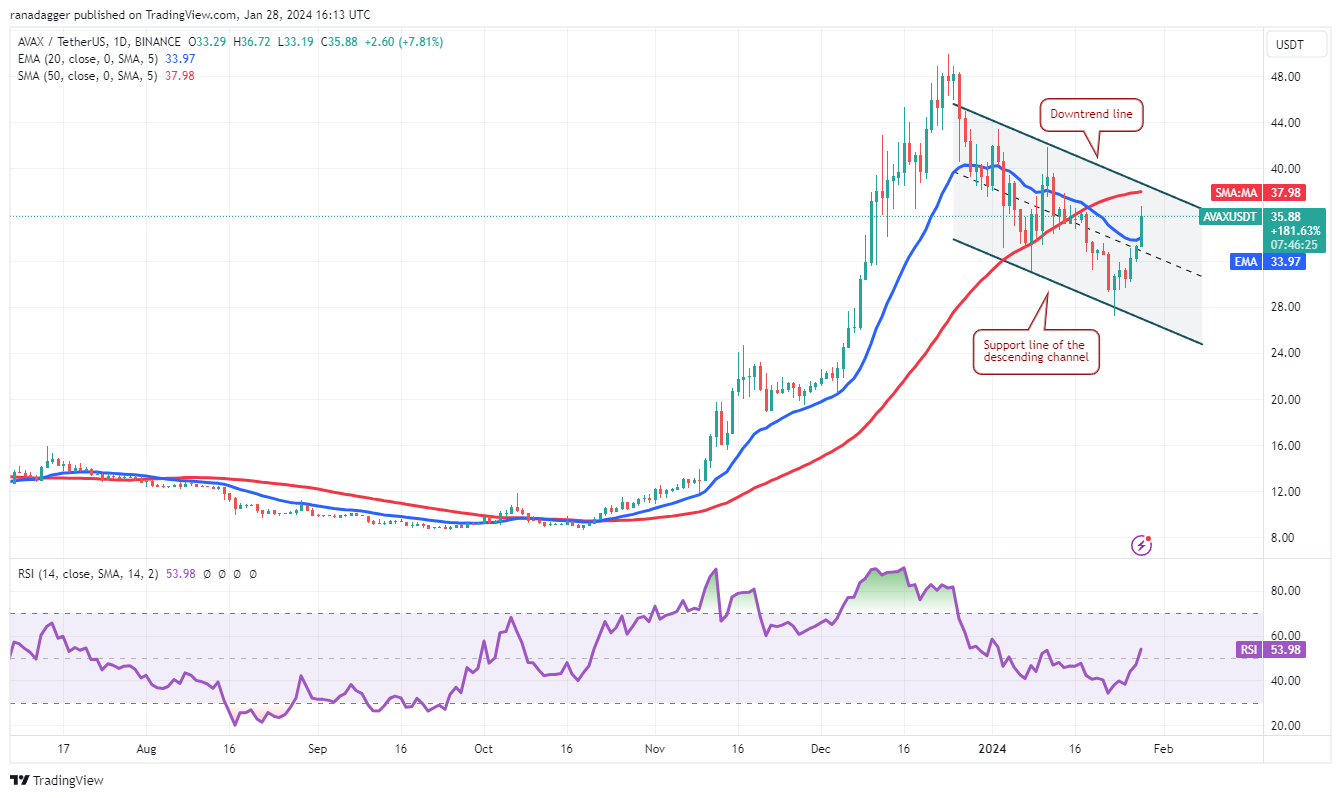
AVAX/USDT daily chart. Source: TradingView
Sellers will try to halt the recovery at the downtrend line. If the price turns down from the overhead resistance, it will suggest that the bears remain active at higher levels. The AVAX/USDT pair may then spend some more time inside the channel.
Instead, if the price pierces the overhead resistance, it will signal aggressive buying by the bulls. The pair may pick up momentum and rally to $44 and subsequently to the psychologically important level of $50.
![]()
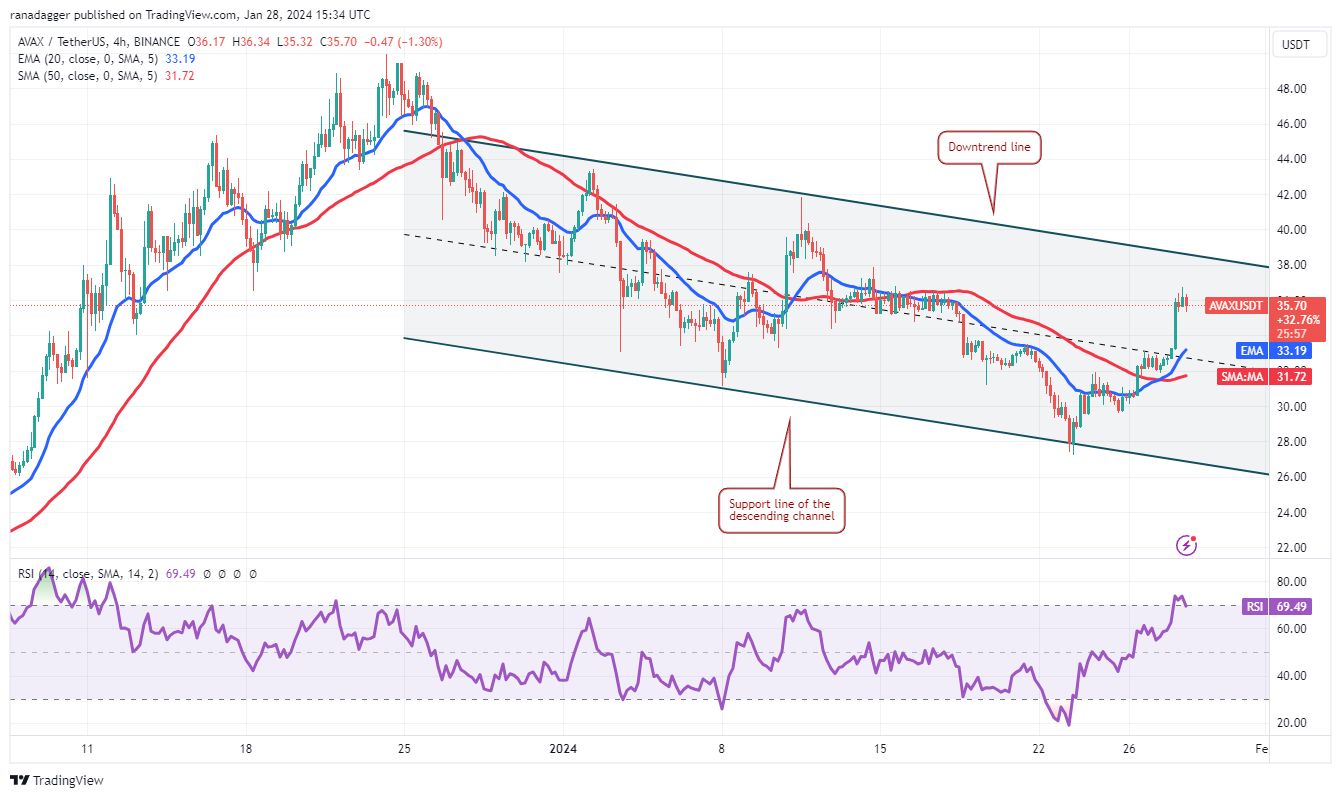
AVAX/USDT 4-hour chart. Source: TradingView
The 20-EMA has started to turn up, and the RSI is near the overbought zone, indicating solid buying by the bulls. Sellers have successfully defended the downtrend line on three previous occasions; hence, they will try to do that again.
If the price turns down from the downtrend line but rebounds off the 20-EMA, it will suggest that traders are viewing the dips as a buying opportunity. That will enhance the prospects of a rally above the channel. If that happens, the pair may start a move to $44.
On the contrary, if the price turns down and breaks below the moving averages, it will suggest that bears are fiercely selling at higher levels. The pair may then remain inside the channel for a while longer.
Related: Bitcoin ETF ads may appear on Google starting Monday, community speculates
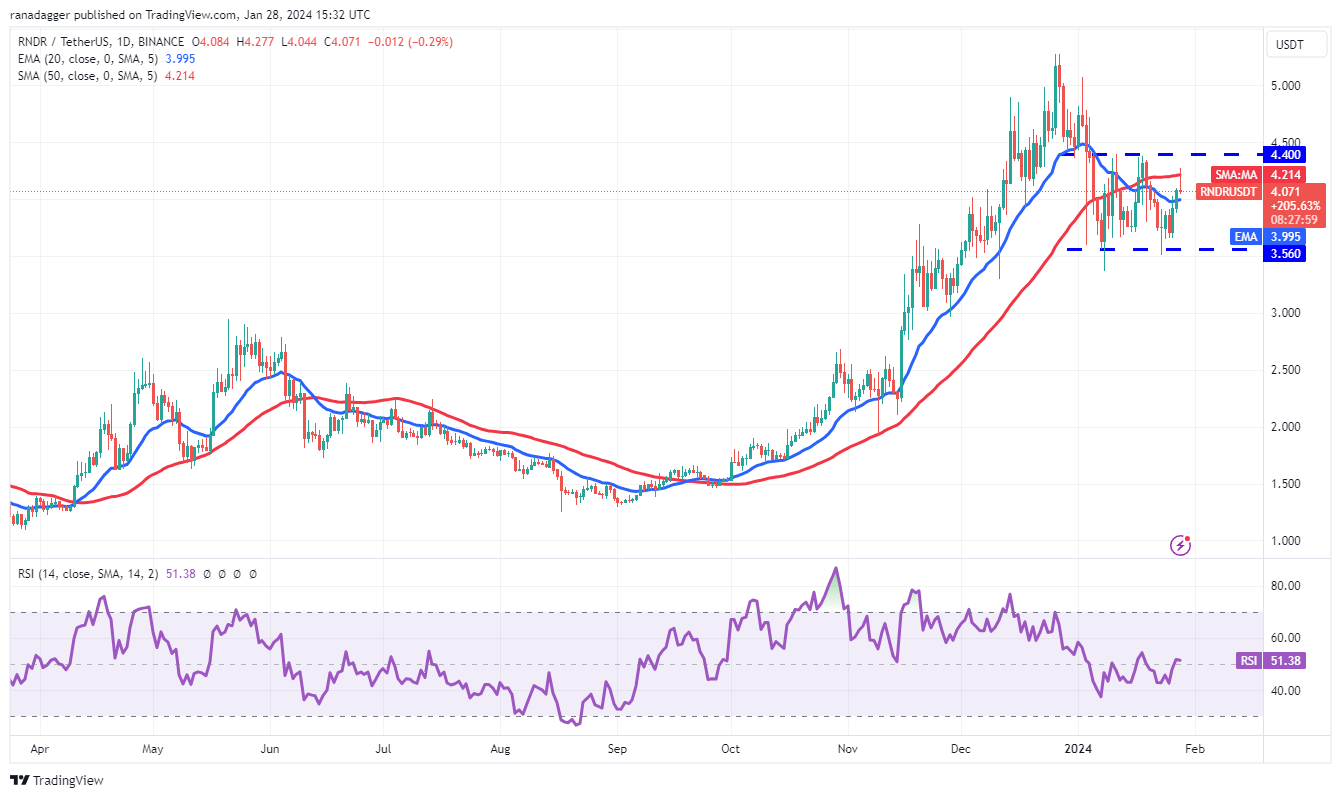
Render price analysis
After the initial pullback, Render (RNDR) has been consolidating between $3.56 and $4.40 for the past few days.
![]()
RNDR/USDT daily chart. Source: TradingView
Both moving averages have flattened out, and the RSI is just above the midpoint, indicating a balance between the bulls and the bears. If the price turns down from $4.40 and breaks below the 20-day EMA ($4), the RNDR/USDT pair may extend its range-bound action for a few more days.
Contrarily, if the price rises above $4.40, it will signal that the buyers have overpowered the sellers. The pair could then rally to $5.07 and eventually to $5.28. A break above this level will indicate the resumption of the uptrend.
![]()
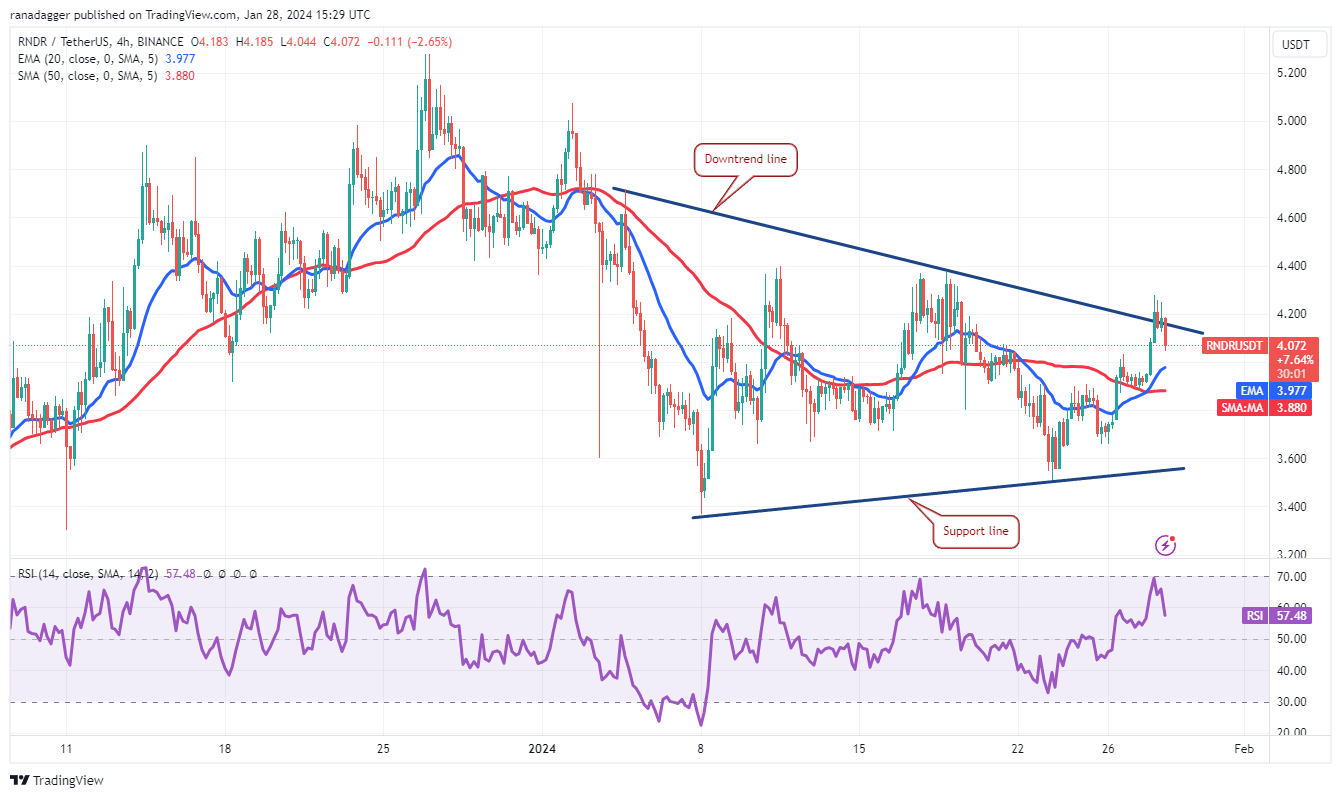
RNDR/USDT 4-hour chart. Source: TradingView
The pair has formed a symmetrical triangle pattern on the 4-hour chart, indicating indecision among the bulls and the bears. The buyers are trying to gain the upper hand by pushing the price above the triangle. If they succeed, the pair may climb to $4.40 and thereafter to $4.71.
Contrary to this assumption, if the price continues lower and breaks below the 20-EMA, it will indicate that the bears are vigorously defending the downtrend line. The pair may then descend toward the support line.
Sui price analysis
Sui (SUI) has been in an uptrend for the past several days, but the bears are trying to halt the rally at $1.50.
![]()
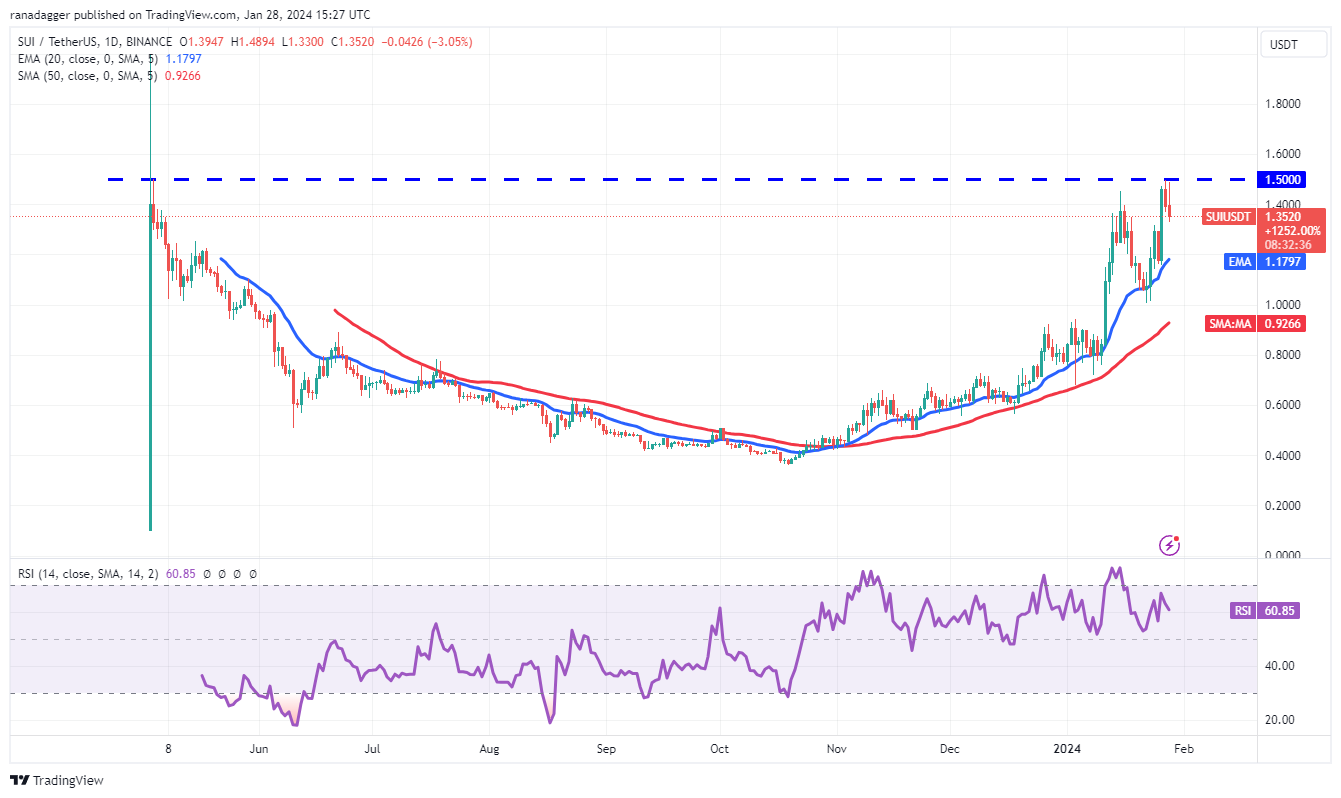
SUI/USDT daily chart. Source: TradingView
The SUI/USDT pair has formed a rounding bottom pattern, which will complete on a break and close above $1.50. If that happens, the bullish momentum could pick up, and the pair may rally toward $2. The pattern target of the positive setup is $2.64.
However, the bears are likely to have other plans. They will fiercely protect the $1.50 level and attempt to pull the price to the 20-day EMA ($1.18). If the price rebounds off the 20-day EMA with strength, the likelihood of a rally above $1.50 increases. On the other hand, a break below the 20-day EMA could open the doors for a decline to the 50-day SMA ($0.92).
![]()
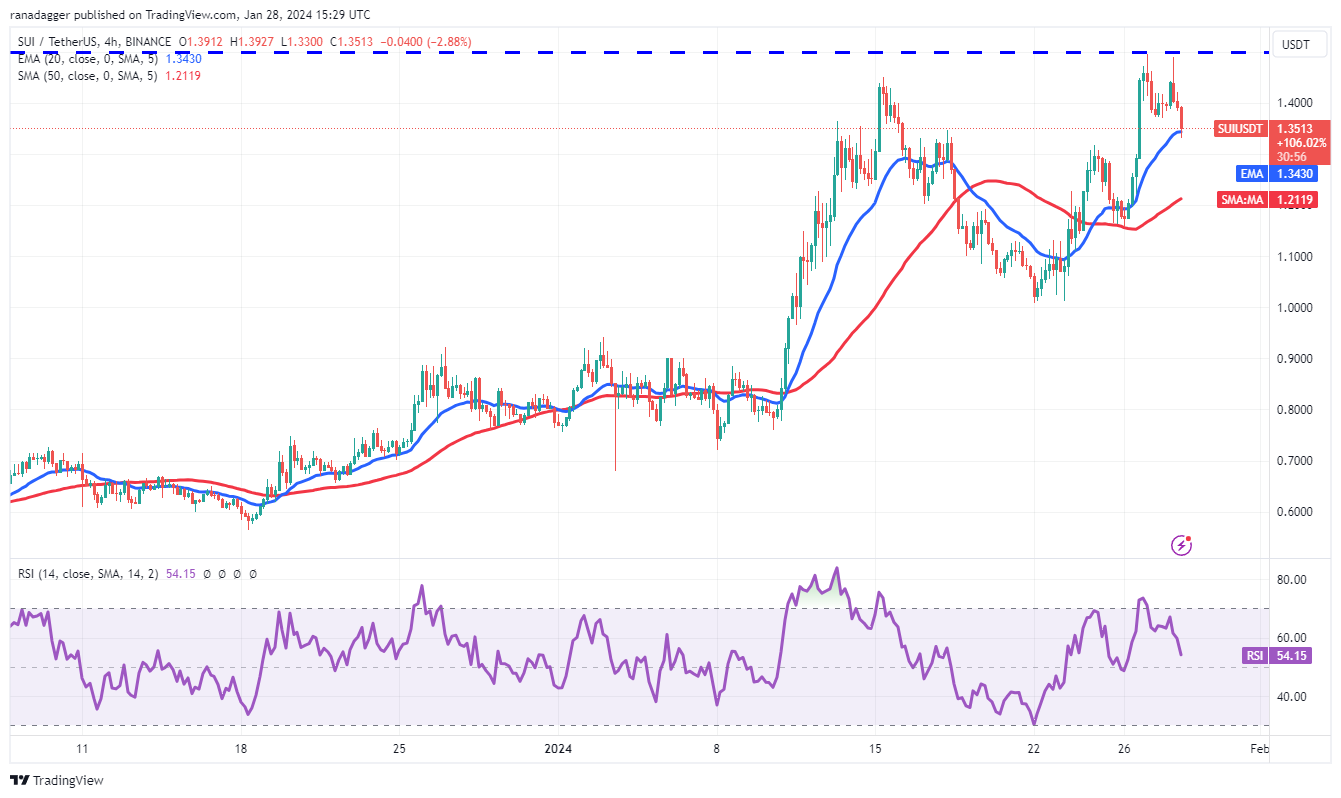
SUI/USDT 4-hour chart. Source: TradingView
The 4-hour chart shows that the bulls are struggling to shove the price above the overhead resistance at $1.50. If the price continues lower and breaks below the 20-EMA, it could start a pullback to the 50-SMA.
Alternatively, if the price rebounds off the 20-EMA, it will suggest that the sentiment remains positive and every minor dip is being bought. The pair may then overcome the obstacle at $1.50 and start the next leg of the uptrend.
This article does not contain investment advice or recommendations. Every investment and trading move involves risk, and readers should conduct their own research when making a decision.