Date: Sun, Dec 21 2025 | 05:34 AM GMT
The broader cryptocurrency market has experienced choppy and directionless price action over the past several weeks, a phase that began following the sharp sell-off on October 10. That correction pushed Bitcoin (BTC) down from sub-$120,000 levels to the current $88,000 area, leaving traders cautious and risk appetite subdued. Over the last 60 days alone, BTC has declined by nearly 18%, reinforcing a short-term bearish narrative across the market.
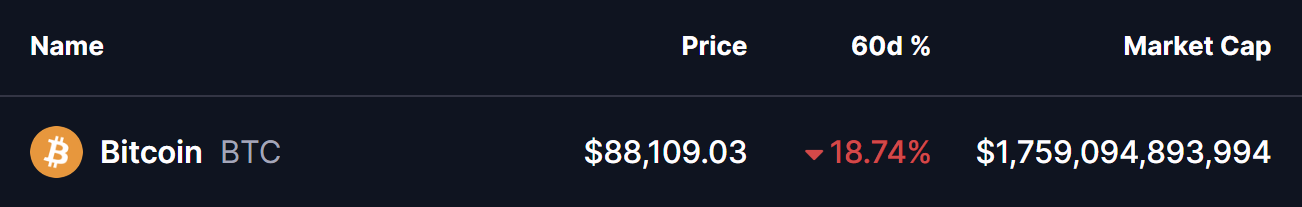 Source: Coinmarketcap
 Despite the ongoing weakness, the higher-timeframe technical picture is beginning to suggest something more constructive. Price behavior on the daily chart now resembles a familiar structure from earlier this year, raising the possibility that downside momentum may be fading and that Bitcoin could be approaching a potential trend reversal rather than an extended continuation lower.
Fractal Setup Hints at a Bullish Reversal
On the 3 day timeframe chart shared by crypto analyst CRG, Bitcoin’s current price action closely mirrors a pattern that played out during March and April 2025. At that time, Bitcoin topped near the $108,000 level before entering a sharp corrective phase that dragged price down into the $74,000–$76,000 range. While the decline appeared aggressive, momentum indicators told a different story beneath the surface.
As price pushed to marginally lower lows, the Relative Strength Index (RSI) failed to confirm the weakness. Instead, it formed a clear higher low, signaling a bullish divergence. This divergence marked a loss of downside momentum and ultimately preceded a strong recovery that carried Bitcoin back above $108,000, followed by a continuation toward fresh highs.
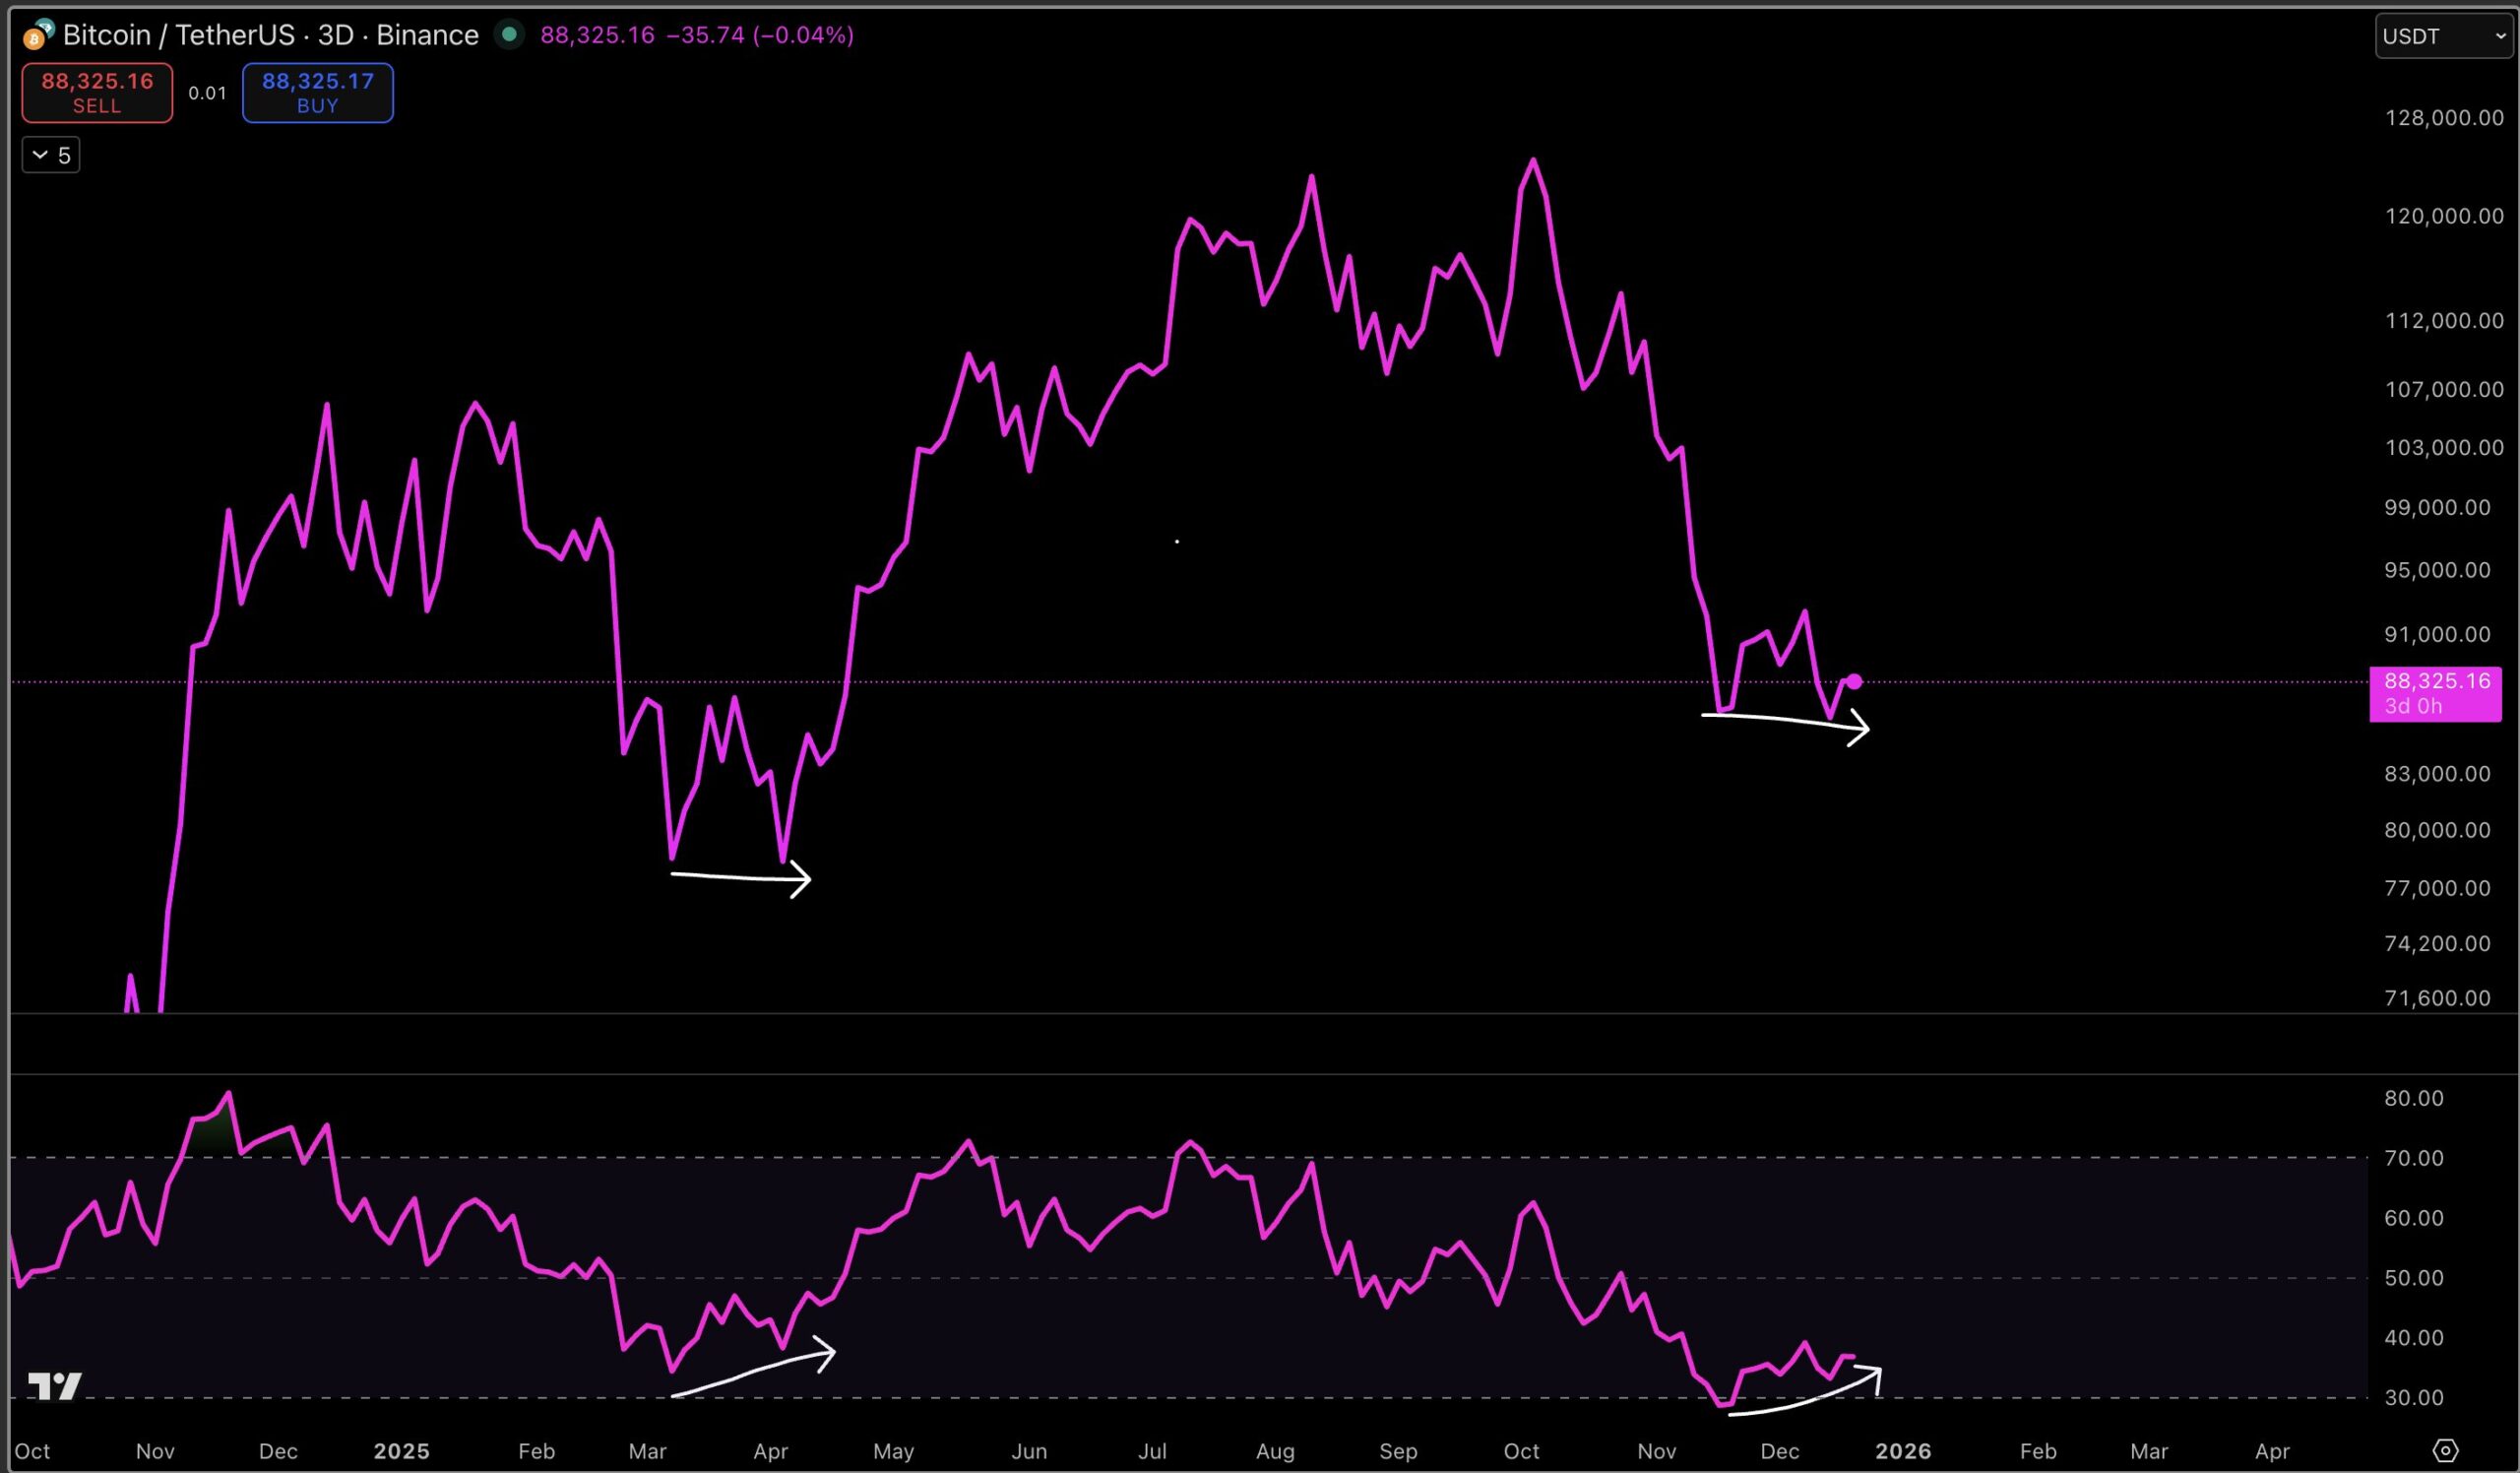 Bitcoin (BTC) Chart/Credits: @MacroCRG (X)
 Fast forward to the present structure, and the similarities are striking.
After peaking in the $120,000–$125,000 zone, Bitcoin once again experienced a sharp sell-off, this time finding support just below $81,000. Since then, price has stabilized and begun consolidating around $88,000, struggling to reclaim higher resistance levels but, importantly, failing to extend meaningfully lower. This lack of downside follow-through mirrors the earlier fractal almost point for point.
Momentum is once again reinforcing the comparison. While price briefly dipped to comparable or slightly lower levels, the RSI did not follow. Instead, it printed a higher low, signaling that bearish pressure is weakening despite continued price compression. This exact momentum behavior was present during the previous corrective phase, just before Bitcoin transitioned into its next impulsive move higher.
What’s Next for BTC?
If the current fractal continues to unfold in a similar manner, the $81,000–$90,000 range may ultimately be viewed not as a breakdown zone, but as a final consolidation area before Bitcoin attempts another move toward six-figure prices. A sustained reclaim of the $95,000–$100,000 region would serve as the first meaningful confirmation that the market is following the prior script.
That said, fractals are not predictive guarantees. They do not offer precise price targets or timelines. Instead, they provide context by highlighting repeating market behavior. When similar structures emerge under similar conditions—especially when confirmed by momentum divergence—the probability of a comparable outcome increases. In the previous instance, that outcome was continuation higher after a period of sideways consolidation.
For now, the message from the chart remains clear. Downside pressure appears to be weakening, momentum is stabilizing, and Bitcoin is behaving in much the same way it did before its last major expansion. While the market may feel quiet and uncertain, history shows that these periods of compression often precede significant directional moves.