Bitget App
Trade smarter
MarketsTradeFuturesEarnSquareMore
Solana (SOL) Dips To Test Key Support — Could This Pattern Trigger an Rebound?

Solana (SOL) Dips To Test Key Support — Could This Pattern Trigger an Rebound?

CoinsProbeCoinsProbe2025/11/15 01:51
By:Nilesh Hembade

Date: Fri, Nov 14, 2025 | 02:50 PM GMT

The cryptocurrency market continues to face heavy selling pressure as both Bitcoin (BTC) and Ethereum (ETH) plunged over 5% in the past 24 hours. The correction triggered more than $1.38 billion in liquidations across the market, with long positions taking the biggest hit — over $1.21 billion wiped out in a single day.

This intense volatility has weighed heavily on major altcoins , including the Layer-1 token Solana (SOL), which is down more than 6%. But beneath this dip, the chart reveals a technical structure that may be preparing SOL for a potential rebound in the coming sessions.

Solana (SOL) Dips To Test Key Support — Could This Pattern Trigger an Rebound? image 0 
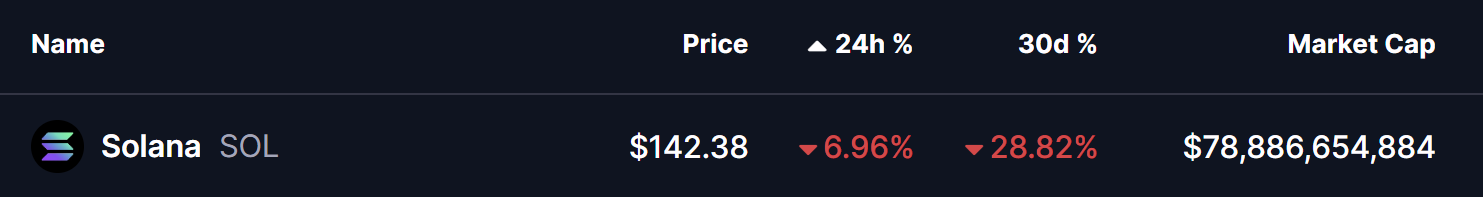
Source: Coinmarketcap

Falling Wedge Pattern in Play

On the daily chart, SOL is currently trading inside a falling wedge — a well-known bullish pattern that typically forms when sellers begin to lose momentum and price compresses into a narrowing structure.

The recent sweep brought Solana down toward the wedge’s lower boundary around $135.76, a level that has acted as a firm reaction zone. From this point, SOL has managed to bounce, climbing back near $142.34, indicating that buyers are stepping in to defend this structure.

Solana (SOL) Dips To Test Key Support — Could This Pattern Trigger an Rebound? image 1 
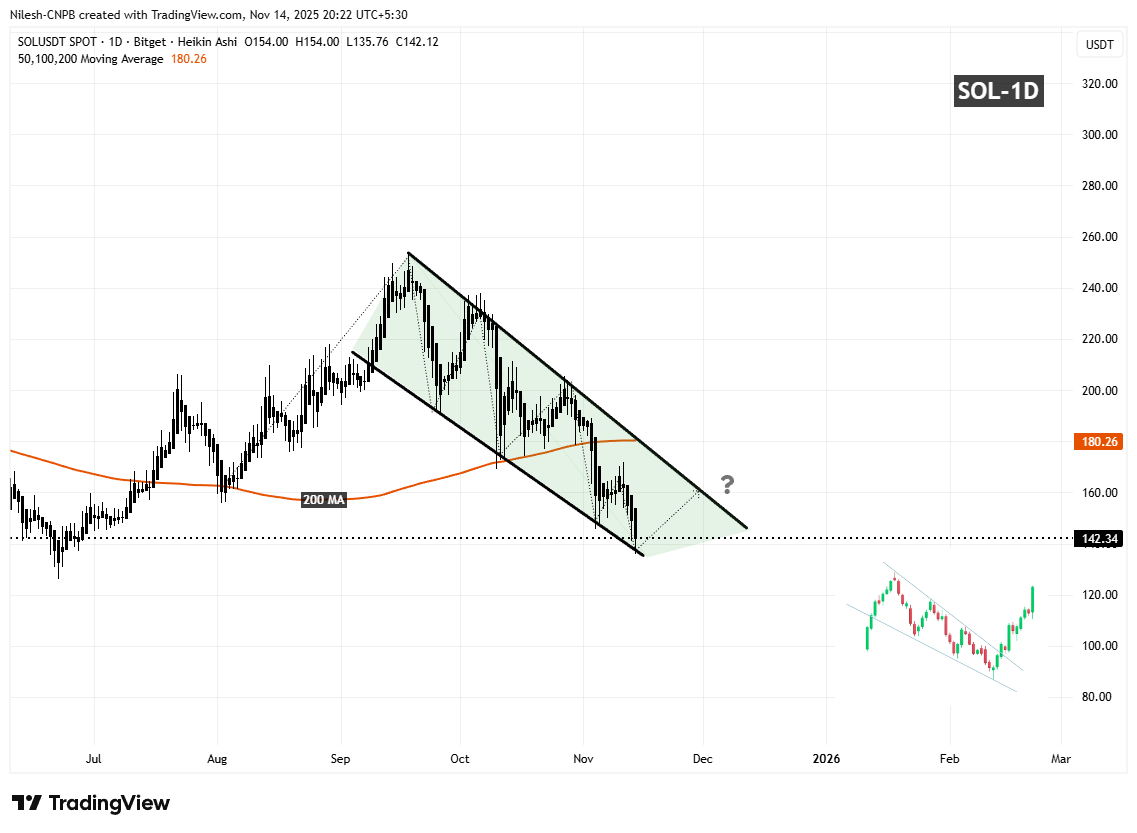
Solana (SOL) Daily Chart/Coinsprobe (Source: Tradingview)

The chart also shows that every touch of the wedge’s lower boundary over the past several weeks has resulted in an immediate upward reaction. This type of price behavior often signals accumulation and seller exhaustion.

What’s Next for SOL?

If Solana continues to hold the support region and maintains strength along the wedge’s lower trendline, upward momentum may start building again. The next key zone to watch is the $156 region, which aligns with the wedge’s upper boundary and has historically acted as resistance.

A confirmed breakout above this level could shift momentum sharply in favor of the bulls, potentially opening the door for a move toward the $273 area — the next major resistance zone highlighted on the chart.

On the flip side, failure to defend the wedge support would be a warning sign. A breakdown could expose SOL to deeper downside pressure, dragging the price toward the $126 level, where the next meaningful support sits.

0

Disclaimer: The content of this article solely reflects the author's opinion and does not represent the platform in any capacity. This article is not intended to serve as a reference for making investment decisions.

You may also like

Ethereum Updates: The Reason Behind Small-Cap Companies Making Major Investments in Crypto Treasuries for 2025

- Small-cap crypto firms are shifting to institutional-grade digital asset strategies in 2025, with companies like Predictive Oncology and Bit Digital accumulating billions in tokens. - Predictive Oncology's $152.8M ATH treasury and Bit Digital's $590.5M ETH holdings demonstrate blockchain-based revenue diversification and staking profitability. - Greenlane's $110.7M BERA token acquisition highlights crypto-driven reinvention challenges, while AI-blockchain integration accelerates efficiency gains in the s

Bitget-RWA2025/11/15 05:44

SOON's Steep Decline Highlights Vulnerability of High-Beta Stocks During Market Volatility

- SOON shares surged 167% before plunging, briefly hitting a $5B FDV. - Analysts highlighted its high volatility (beta 1.05) and overvaluation (P/E 24.09) amid market jitters. - A $2.13B crypto liquidation spike and macroeconomic uncertainty amplified SOON's sharp correction. - Technical indicators showed neutral sentiment, but bearish retail trading drove the sell-off. - The episode underscored fragility of high-beta stocks amid Fed policy shifts and AI sector pressures.

Bitget-RWA2025/11/15 05:44
SOON's Steep Decline Highlights Vulnerability of High-Beta Stocks During Market Volatility

Bitcoin News Update: Crypto Fear Index Drops Sharply—Sign of Surrender or Spark for a Rebound?

- Crypto Fear & Greed Index hit 16, its lowest since February 2025, reflecting extreme bearish sentiment amid Bitcoin and altcoin sell-offs. - Technical indicators and on-chain data show Bitcoin below key moving averages, with 815,000 BTC sold by long-term holders in 30 days. - Analysts highlight $100,000 as critical support, warning further declines if broken, while some see panic-driven buying opportunities. - Technical patterns suggest potential rebounds to $120,000-$126,000 if support holds, contrastin

Bitget-RWA2025/11/15 05:26
Bitcoin News Update: Crypto Fear Index Drops Sharply—Sign of Surrender or Spark for a Rebound?

Bitcoin Updates: Crypto Confidence Wavers—Saylor Calms Fears as Bearish Trends Persist

- Michael Saylor denied rumors of MicroStrategy selling Bitcoin , calming panic after $5.7B in crypto transfers to new wallets triggered market volatility. - Arkham clarified the 43,415 BTC wallet movements as routine custody management, but shares fell 7.2% as investor anxiety over the firm's financial health persisted. - Bitcoin traded near its 50-week SMA at $97,000 amid $870M ETF outflows, with analysts warning of further underperformance against gold and tech stocks in 2025. - Corporate Bitcoin accumu

Bitget-RWA2025/11/15 05:26
Bitcoin Updates: Crypto Confidence Wavers—Saylor Calms Fears as Bearish Trends Persist