Solana News Update: Solana ETFs Draw $421 Million in Investments Despite 8% Price Drop, Revealing a Gap in Institutional and Market Sentiment
- Solana (SOL) dropped 8% to $167, wiping out 2024 gains despite $421M inflows into new U.S. spot-based ETFs. - ETF inflows contrasted with Bitcoin/Ethereum outflows ($543M and $210M), highlighting institutional rotation toward Solana's 7% staking yields. - Technical indicators show bearish momentum (23:1 long liquidation ratio), with analysts warning of potential 30% correction to $115. - Bitwise's 0.20% fee ETF (BSOL) attracted $197M in four days, outperforming BlackRock's Bitcoin ETF but failing to stab
Solana (SOL) dropped by 8% on Thursday, continuing its downward trend for the week even after the launch of the first U.S. spot-based
The Bitwise Solana Staking ETF (BSOL) led the influx, pulling in $197 million within its first four days, while the Grayscale Solana Trust (GSOL) saw $2.2 million in new funds, according to a
ETF inflows stood in stark contrast to the outflows seen from Bitcoin and
Technical signals indicate the market is at a pivotal point. Solana has slipped below its 200-day exponential moving average, and derivatives data reveal a bearish trend, with long positions being liquidated at a rate nearly 23 times higher than shorts in the last 24 hours, according to an
Although the short-term outlook remains uncertain, the introduction of these ETFs marks a step forward in crypto market maturity. Bitwise’s BSOL, with a 0.20% management fee—lower than Grayscale’s 0.35%—drew nearly ten times the inflows of BlackRock’s Bitcoin ETF in its debut week, as reported by Yahoo Finance. Despite this achievement, price stability has yet to follow, as traders remain wary amid ongoing market volatility, the Economic Times report noted.
---
Disclaimer: The content of this article solely reflects the author's opinion and does not represent the platform in any capacity. This article is not intended to serve as a reference for making investment decisions.
You may also like
YFI rises 1.75% on NOV 5 2025 During Brief Pullback and Sustained Upward Trend
- YFI surged 1.75% on Nov 5, 2025, but faces 6.51% weekly/monthly declines and a 44.94% annual drop. - Market remains volatile short-term yet retains long-term bullish momentum from multi-year trends. - Mixed technical indicators show daily RSI recovery but weekly oversold conditions and positive MACD divergence. - A backtest strategy evaluates YFI's rebound potential after 10% single-day drops using 2022 historical data.
Bitcoin Bloodbath: BTC Price Plunges Below $100K as Whales Vanish and Traders Brace for More Selloff
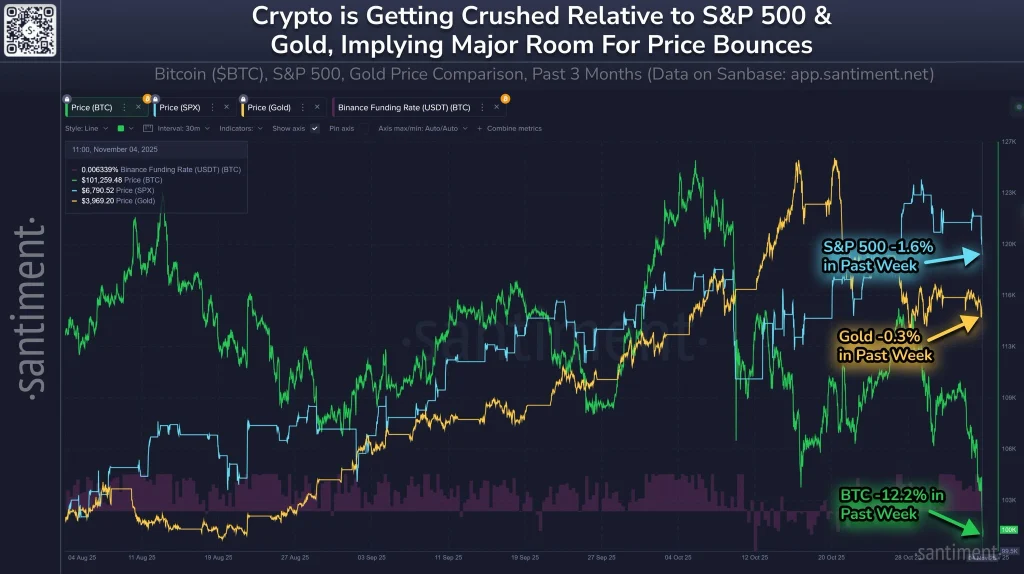
Crypto Get Crushed Relative to Gold and S&P 500, Santiment Predicts a ‘Rubber-Band’ Rebound