Bitget App
Trade smarter
The Sandbox (SAND) Holds Key Support — Could This Pattern Trigger an Upside Breakout?

The Sandbox (SAND) Holds Key Support — Could This Pattern Trigger an Upside Breakout?

CoinsProbeCoinsProbe2025/10/29 14:00
By:Nilesh Hembade

Date: Wed, Oct 29, 2025 | 08:20 AM GMT

The broader cryptocurrency market is showing a cautious tone head of today’s the Federal Reserve’s policy meeting, where a potential interest rate cut remains a key focus. Both Bitcoin (BTC) and Ethereum (ETH) are slightly in the red, extending mild weakness across major altcoins — including The Sandbox (SAND).

While SAND is seeing a modest dip today, the latest chart formation suggests that the token might be preparing for a larger directional move, provided it continues to hold its crucial support level.

The Sandbox (SAND) Holds Key Support — Could This Pattern Trigger an Upside Breakout? image 0 Source: Coinmarketcap

Holds Symmetrical Triangle Support

On the 4-hour chart, SAND has been consolidating within a symmetrical triangle pattern — a neutral yet often powerful technical setup that typically precedes a volatility breakout.

After facing an 8% rejection from the triangle’s upper resistance zone, SAND pulled back to retest its ascending support trendline near $0.2057. Buyers once again stepped in around this level, defending the structure and helping price rebound to about $0.2112, showing early resilience.

The Sandbox (SAND) Holds Key Support — Could This Pattern Trigger an Upside Breakout? image 1 
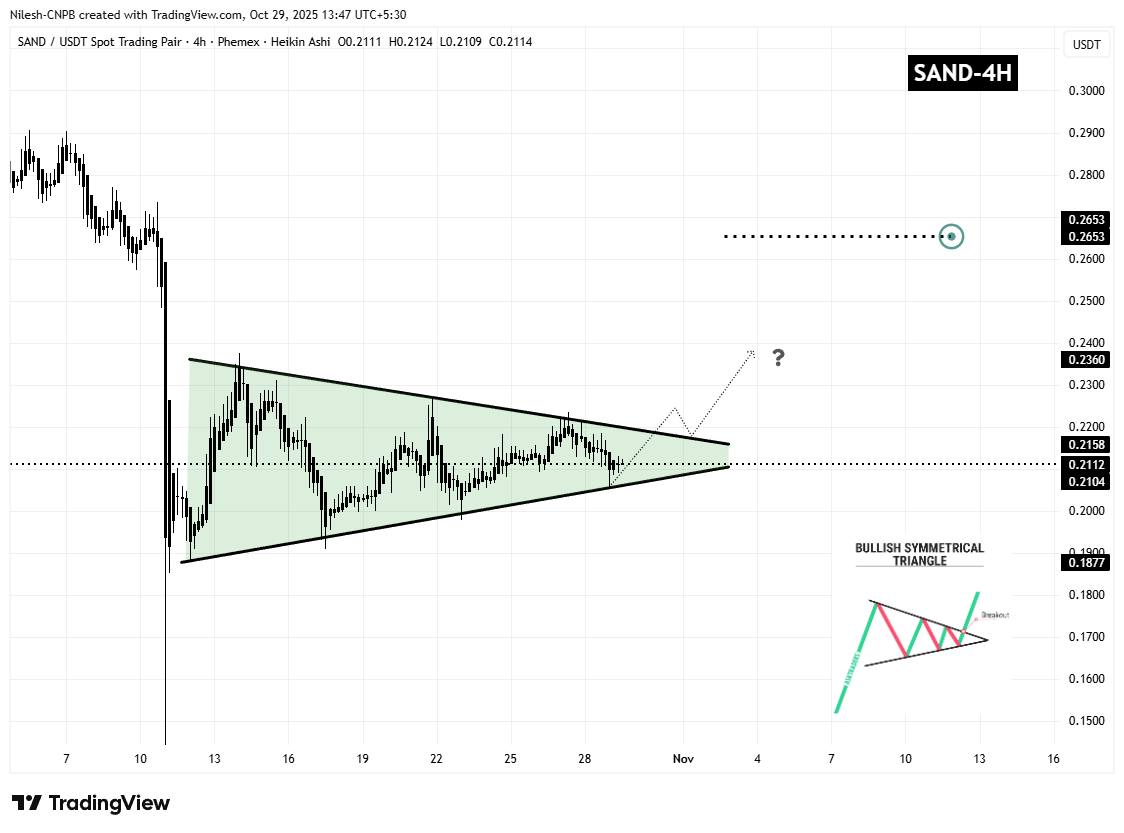
The Sandbox (SAND) 4H Chart/Coinsprobe (Source: Tradingview)

This ascending support trendline has consistently acted as a dynamic demand zone since the October 10 crash, cushioning each pullback and reinforcing the base of the current pattern.

What’s Next for SAND?

If bulls can defend the ascending support trendline, SAND may soon attempt a retest of the triangle’s upper boundary near $0.2180. A decisive breakout and retest above this resistance zone could open the door for a trend expansion, with an upside target near $0.2653 — a level that aligns with the measured move projection from the triangle formation and previous swing highs.

Conversely, if price fails to sustain above support, SAND could experience renewed selling pressure, potentially sliding toward the lower triangle boundary before any renewed breakout attempt.

For now, the technical structure remains intact, suggesting that the next few sessions could be pivotal in determining whether SAND breaks upward or remains trapped in consolidation mode.

0

Disclaimer: The content of this article solely reflects the author's opinion and does not represent the platform in any capacity. This article is not intended to serve as a reference for making investment decisions.

You may also like

DeFi Faces Trust Issues: User Access Enables Latest Base Blockchain Vulnerability

- CertiK reported a Base blockchain exploit draining 55 WETH via an unverified contract, highlighting DeFi's persistent smart contract risks. - Unverified contracts remain a critical vulnerability, as attackers exploit user-authorized permissions to drain funds. - Mutuum Finance (MUTM), despite a 90/100 CertiK audit score, underscores the need for continuous monitoring amid DeFi's security challenges. - The incident reinforces calls for rigorous contract verification, user due diligence, and proactive risk

Bitget-RWA2025/10/30 04:20
DeFi Faces Trust Issues: User Access Enables Latest Base Blockchain Vulnerability

Hyperliquid News Today: Shifting from Excitement to Responsibility: Noomez's Presale Transforms Confidence Among Crypto Investors

- Turbo Coin (TURBO) plunges to $0.00247 amid bearish indicators, while Noomez ($NNZ) gains traction via transparent presale and deflationary mechanics. - Technical analysis shows TURBO's 50/200-day averages declining, with short-term forecasts predicting $0.0019 by November before potential 2030 recovery to $0.0065. - Noomez's structured 28-stage presale burns unsold tokens, locks liquidity, and features KYC-verified founders, contrasting with TURBO's volatile open-market dynamics. - Market shifts highlig

Bitget-RWA2025/10/30 04:20
Hyperliquid News Today: Shifting from Excitement to Responsibility: Noomez's Presale Transforms Confidence Among Crypto Investors

XLM drops 13.57% over the past month as technical signals point to stabilization near the $0.30 support level

- XLM fell 13.57% in a month to $0.3171, consolidating near $0.30 support with buyers testing key levels. - Technical indicators like MACD and RSI signal potential bullish momentum, with RSI divergence weakening bearish pressure. - A falling wedge pattern and accumulation at $0.20–$0.30 suggest a possible breakout toward $0.38 resistance. - Derivatives funding rates and on-chain data highlight growing confidence in XLM’s short-term recovery potential.

Bitget-RWA2025/10/30 04:16

Bitcoin News Today: Bitcoin Cash Faces $570-571 Resistance: Will Network Upgrades and ETF Optimism Spark a 2025 Rally?

- Bitcoin Cash (BCH) rebounded to $565 after October's $500 low, driven by 45.8% higher trading volume and protocol upgrades enhancing smart contract capabilities. - May 2025 upgrades including expanded VM limits and BigInt position BCH as a low-cost Ethereum alternative, while Grayscale's ETF filing signals growing institutional interest. - Price faces critical $570-571 resistance despite 3.5% volatility narrowing, with November's Electronic Cash Conference and potential 2026 block time reduction key exec

Bitget-RWA2025/10/30 04:04
Bitcoin News Today: Bitcoin Cash Faces $570-571 Resistance: Will Network Upgrades and ETF Optimism Spark a 2025 Rally?