

Date: Sun, Aug 24, 2025 | 10:20 AM GMT
The cryptocurrency market is taking a breather today after a strong rally triggered by Jerome Powell’s comments at the Jackson Hole event, where he hinted at potential rate cuts in September. Ethereum (ETH) briefly touched a new all-time high of $4,878 before cooling off to around $4,740, but the bullish energy has already sparked momentum across several altcoins .
Among them, Saga (SAGA) is drawing attention as its chart structure is beginning to mirror the explosive breakout that recently played out in Bio Protocol (BIO).
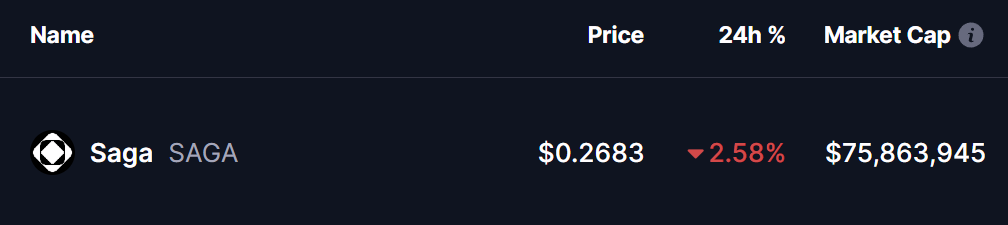 Source: Coinmarketcap
SAGA Mirrors BIO’s Breakout Structure
BIO’s price action serves as a textbook example of a fractal in play. After forming a falling wedge, a well-known bullish reversal pattern, BIO consolidated below its 100-day moving average and red resistance zone before reclaiming the 200-day MA and eventually launching into a parabolic rally of more than 300%.
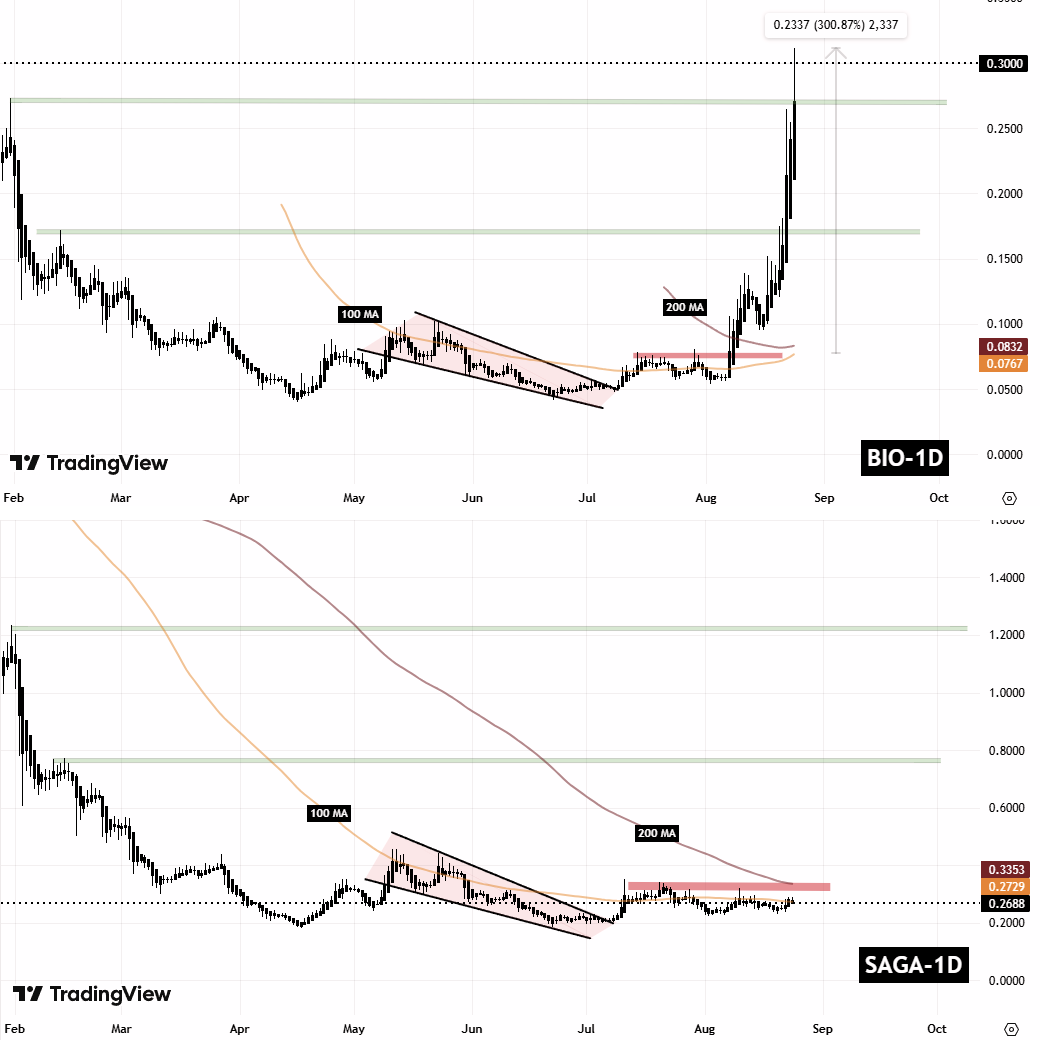 BIO and SAGA Fractal Chart/Coinsprobe (Source: Tradingview)
Now, Saga’s daily chart appears to be tracing an eerily similar path.
The token has already broken out of its own falling wedge and is currently hovering near its 100-day moving average, with immediate resistance at the red horizontal zone and the 200-day MA around $0.3354.
This setup strongly resembles the pre-breakout conditions that fueled BIO’s massive upside surge.
What’s Next for SAGA?
If history repeats and SAGA continues to follow BIO’s fractal, the next key step would be a confirmed breakout above the 200-day MA. A decisive reclaim of this level could trigger strong upside momentum and potentially propel SAGA toward the $1.23 region, mirroring the explosive trajectory of BIO.
On the flip side, failure to clear the 200-day MA could keep SAGA trading sideways and delay the bullish scenario. Traders should closely watch how price reacts around these critical moving averages.